
Neue Methode zur QRS- und T-Wellen Erkennung für eine verbesserte QT-Analyse im EKG
- chair:Digital signal processing
- type:Diplomarbeit
- tutor:
- person in charge:
-
New approach for QRS- and T-wave detection for improved QT studies
To detect serious heart diseases as well as to study drug influences the analysis of the heart’s timing plays a crucial role. In this context the time period required for a heart’s contraction and subsequent relaxation is an important parameter.
Since both processes (contraction and relaxation) involve electrical activity (the heart muscles’ depolarization and repolarization), those can be measured as characteristic curves of the skin surface’s potential. Typically, in medical applications these surface signals are recorded as electrocardiograms (ECG).
The measured ECG signals’ morphology is unique for each patient’s genetics and also depends on the electrodes’ positions on the skin, the measurement system and noise influences.
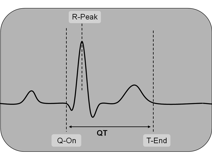
Figure 1: Marked points in ECG signal
This project’s goal is to find a fully automated routine which features the detection of both the beginning and the end of the heartbeat’s polarization cycle, known as Q-onset and T-end point. So, finally the cycle’s duration, the so-called QT-time can be determined.
Since modifications of the QT-time of a few milliseconds are already crucial for decisions regarding the patient’s healthiness or the approval of a new drug, much effort has to be done to develop the algorithm as stable and as accurate as possible.
Firstly, the algorithm is supposed to rate the given ECG signal’s quality. In case there are multiple parallel recorded channels available, a decision has to be drawn based on the signal’s quality score. To remove noise-like influences of the measurement system and the environment the selected channel is denoised using common methods of signal filtering.
Lastly, to detect characteristic points including Q-onset, R-peak and T-end the fiducial point detection algorithm is performed. The algorithm is to use methods such as wavelet analysis, cross correlation analysis and principal component analysis.
The results consist of time series that are used in a further step as input for a multivariate model. This model, which is also being developed at the Institute of Biomedical Engineering is to predict the heart’s behavior for short intervals. Comparing the model’s prediction to the measured data, significant deviations indicate external influences like the effect of a drug. To meet medical requirements regarding stability and reliability the model uses additional input data like blood pressure measurements, too.
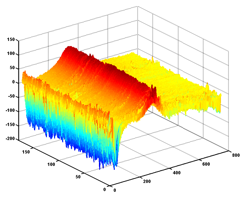
Figure 2: Multiple T waves of an ECG signal